
Graph Perf Update: 1296 chars to Region per Frame: (updated post 2x)
- RaspiPi4 11.34ms (regioned) + 5.5ms (draw)
- PC 1.93ms (regioned) + 0.28ms (draw)
Performance update from commit 607eb99b9cad227dd7be6d149c6b6cf57d060c35
(Note: There I mentioned the total duration for 20 frames, not per frame)
Edit: I have updated the logs and numbers, now with vsync swap-buffers turned off. However, this seems to make no difference on the Raspi 4b. Also added screenshots of the visual performance analysis. Above a screenshot from a Raspberry Pi 4b (console) using a 800×480 pixel screen.
All Raspberry Pi 4 results were using our DRM EGL/GBM console driver and the Open Source ES3.1 driver and GLContext.
regioned is the process where all single pre-computed OutlineShape instances per Glyph are processed to become one Region. This process includes our Font layouting and Region.addOutlineShape().
Region.addOutlineShape() itself performs the triangulation of the shapes, compounding of all vertices and pushing all data down to the VBO buffer, ready to be rendered. Hence, the crucial Graph hotspot.
A Performance @ 2.4.0 with 119,787 vertices:
– doc/curve/tests/perf00/rpi4_old.log
– RaspiPi4 57.20ms (regioned) + 23.4ms (draw)
B Performance @ last commit with 81,092 vertices:
– doc/curve/tests/perf01/rpi4_7.log + doc/curve/tests/perf01/pc_7.log
– RaspiPi4 11.76ms (regioned) + 3.5ms (draw)
– PC 3.4ms (regioned) + 0.35ms (draw)
C Now with 81,092 vertices from a 1296 character string and font FreeSans (vsync off):
– doc/curve/tests/perf02/rpi4_10.log + doc/curve/tests/perf02/pc_10.log
– RaspiPi4 11.34ms (regioned) + 5.5ms (draw)
– PC 1.93ms (regioned) + 0.28ms (draw)
Hence we have achieved a reasonable performance enhanced from A -> C.
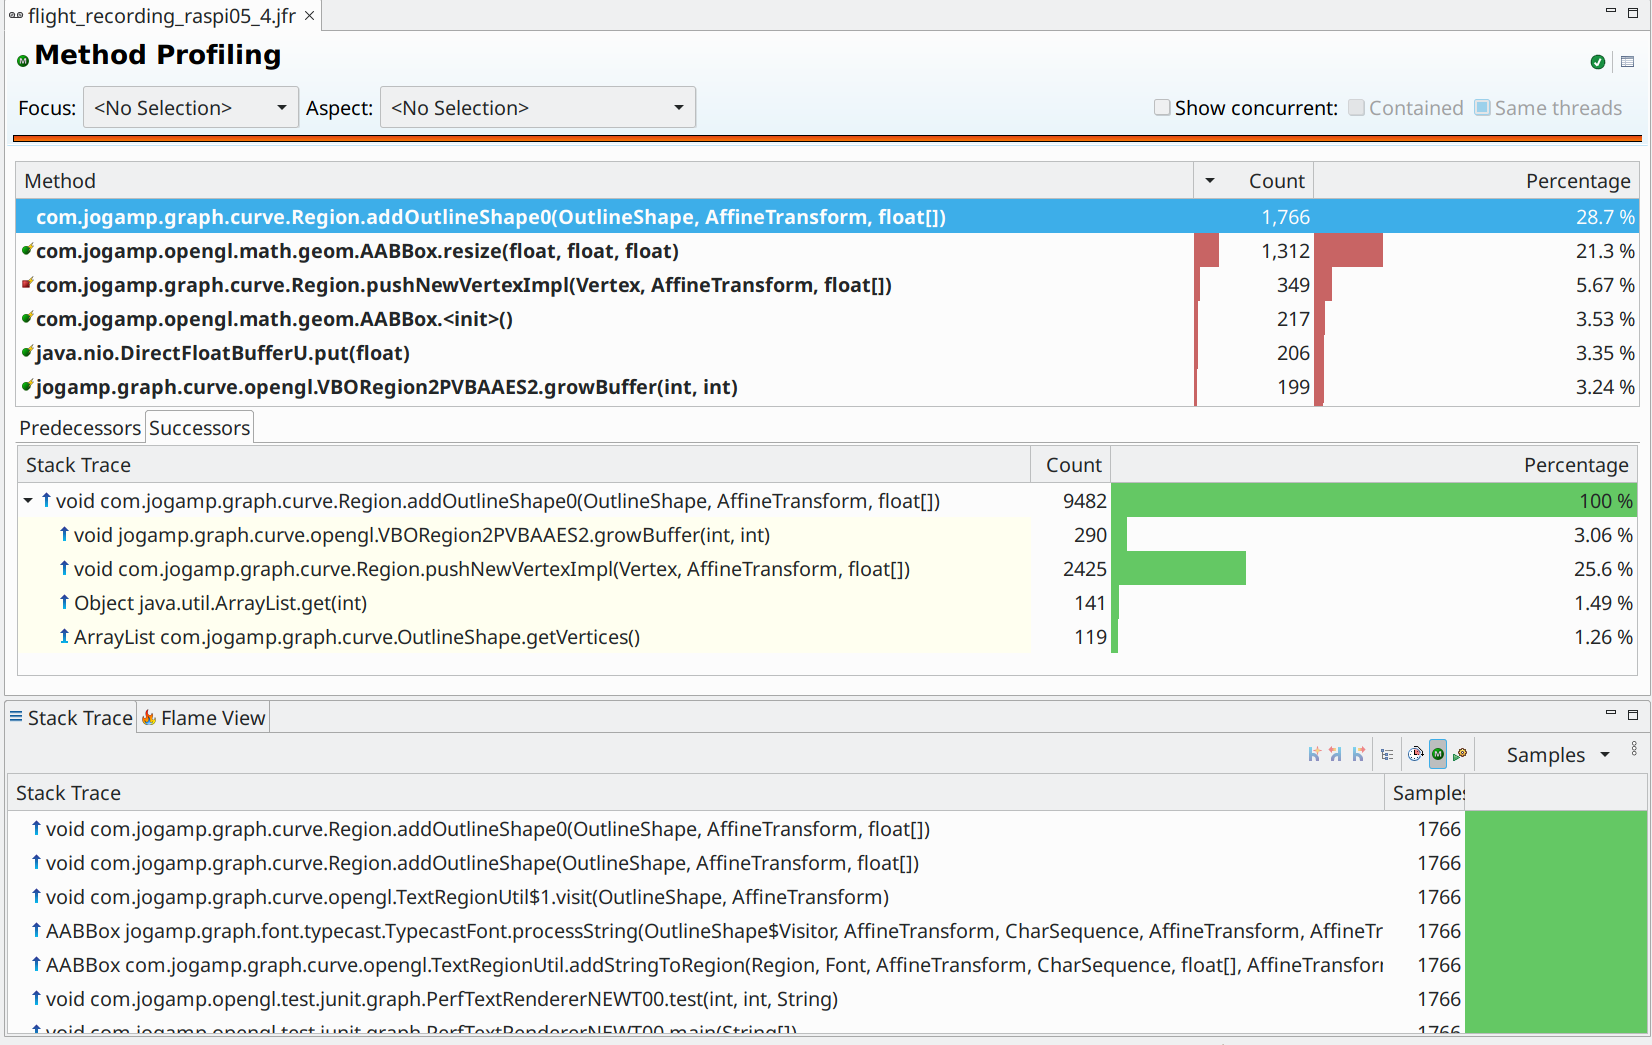
Most important is that neither Flight Recorder nor Visual VM could identify
Region.addOutlineShape()‘s triangulation nor its compounding of all vertices to be a significant bottleneck.
After further triangulation bugfixes (delauny tessellation), we will re-validate this part.
Enhancements of VBO GLArrayData data management
where Region.addOutlineShape() finally pushes the data into the VBO helped to remove certain overhead.
The buffer-size enhancements including API-hooks to count the required vertices & indices to issue Region.setBufferCapacity() helped to ease the GC.
Raspi 4b Flight Recorder Screenshot after 1 minute of intensive method sampling
The following JVM launch options were used.
-XX:+UnlockDiagnosticVMOptions -XX:+DebugNonSafepoints
-XX:FlightRecorderOptions=stackdepth=2048,threadbuffersize=16k
Raspi 4b Visual VM Screenshot after 1 minute of intensive CPU sampling (10ms)
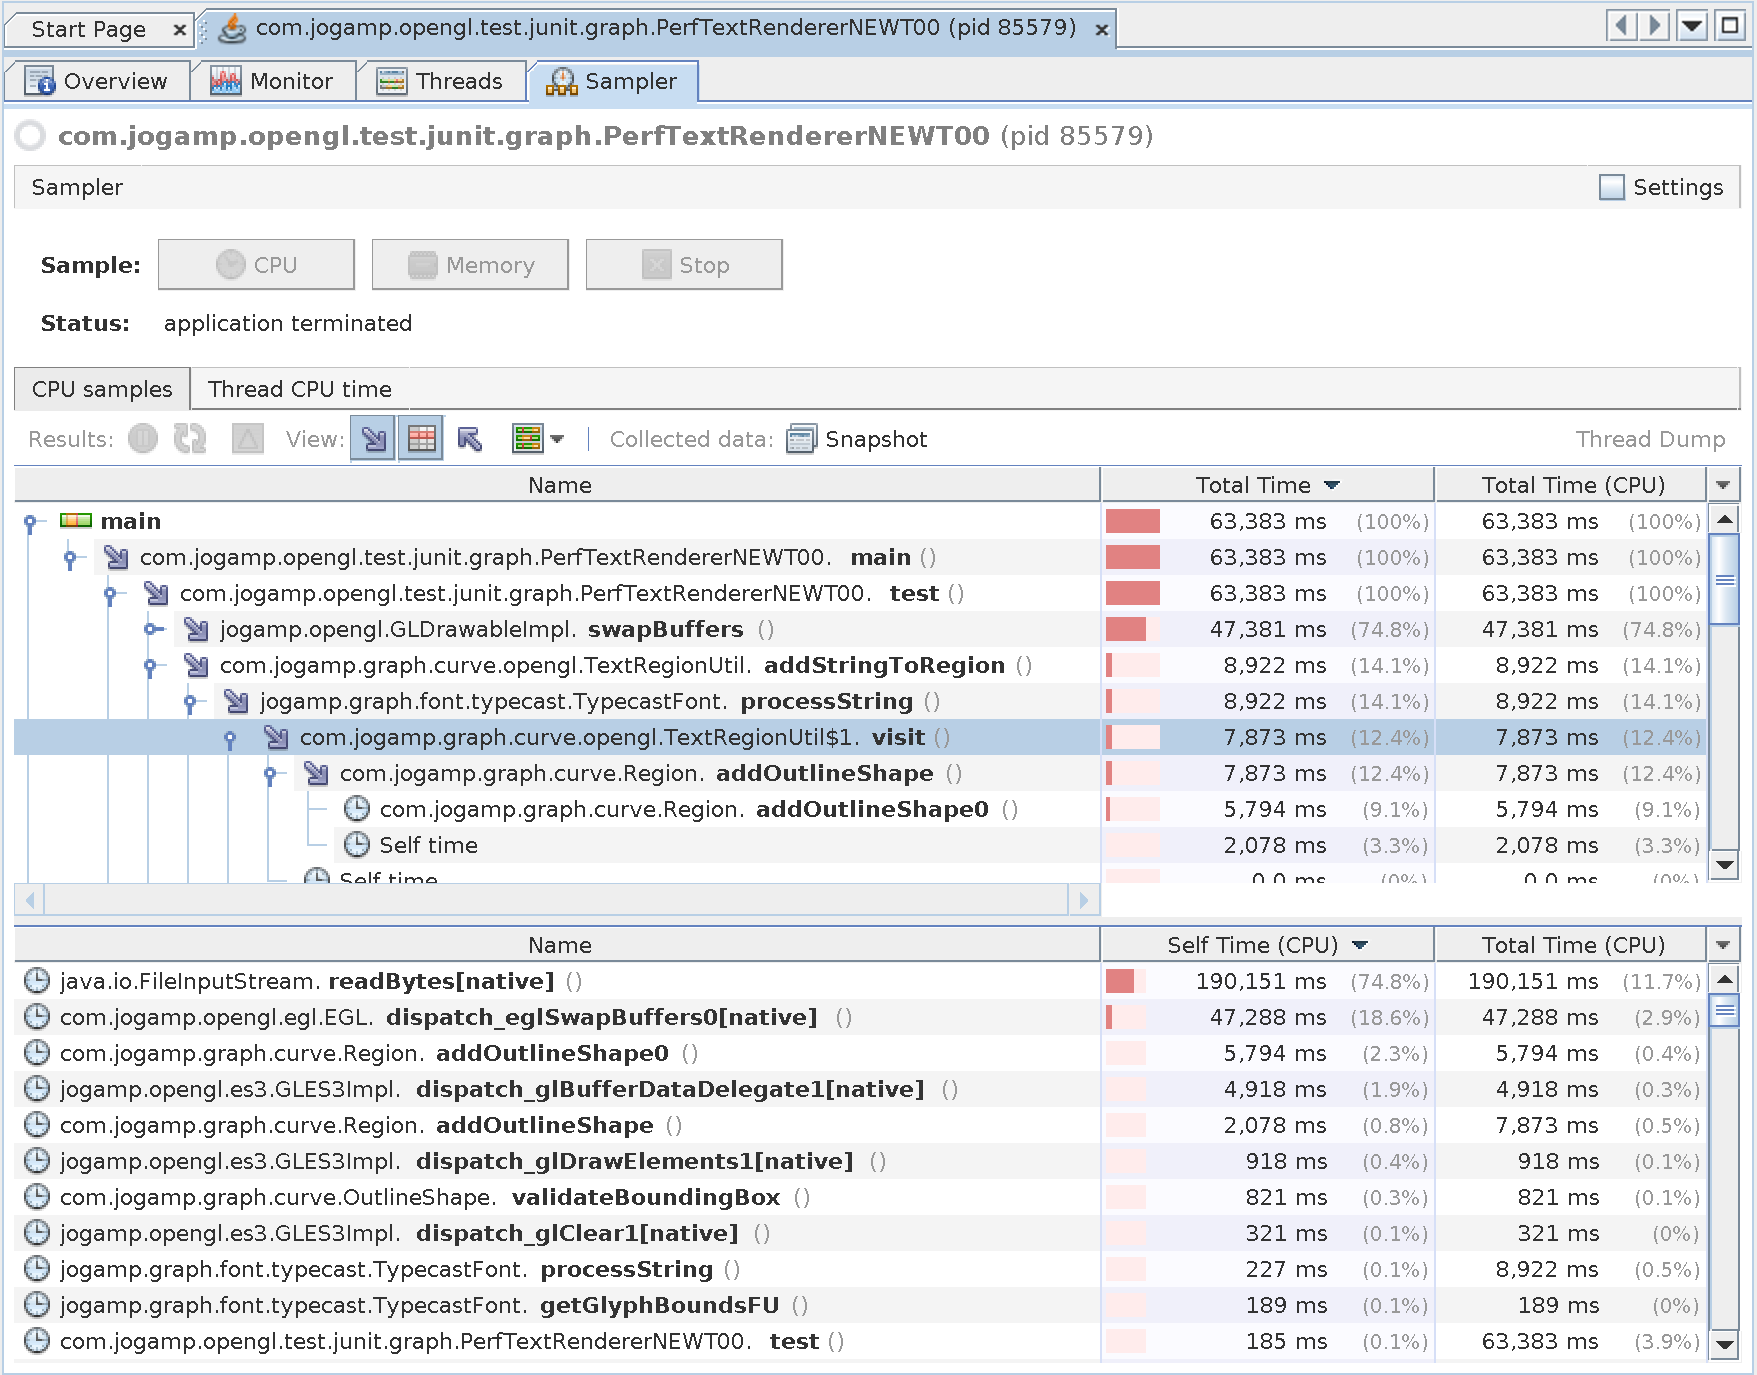 Interestingly Visual VM still shows swapBuffers to be a performance hog, despite not using VSync.
Perhaps I have to test on a lower resolution, since this test here use a screen pixel size of 1920 x 1080, not quite the usual embedded device resolution maybe 😉
OK, almost same on a different Raspi-4b machine using a 800 x 480 resolution screen.
Here we have 10.65ms for region and 3.75ms to draw w/ a slightly longer text of 1315 chars instead of 1296.
VisualVM showed swap-buffer being the hog 😉
(Produced with commit 9e3070acf9c70a8b333435889ae77e581cd65b32)
Added the Raspi4b screenshot from the other device …
One unexpected overhead was the chosen FSAA from the GLCapabilities, … memories ..
https://jogamp.org/cgit/jogl.git/commit/?id=adfe4abec47313d2c533096f6c3e9a94d2fc4571
Graph GPUUISceneNewtDemo: Filter out all FSAA (multisample) caps if undesired (Graph VBAA + MSAA); Add NonFSAAGLCapabilitiesChooser
Notable: On RaspiPi4b w/ Mesa3D’s Broadcom/VC driver,
the chosen capabilities is a multisamnple one even though not requested.
This causes
– extra performance overhead
– doubled AA: 1st our VBAA, then the FSAA (multisample) -> loss of sharpness
Simply dropping the undersired FSAA helps and ups performance
on the Raspi board (22 -> 35 fps).